CO_Emission_Trends_1990-2024.png
An official website of the State of Georgia.
The .gov means it’s official.
Local, state, and federal government websites often end in .gov. State of Georgia government websites and email systems use “georgia.gov” or “ga.gov” at the end of the address. Before sharing sensitive or personal information, make sure you’re on an official state website.
Still not sure?
Call 1-800-GEORGIA to verify that a website is an official website of the State of Georgia.
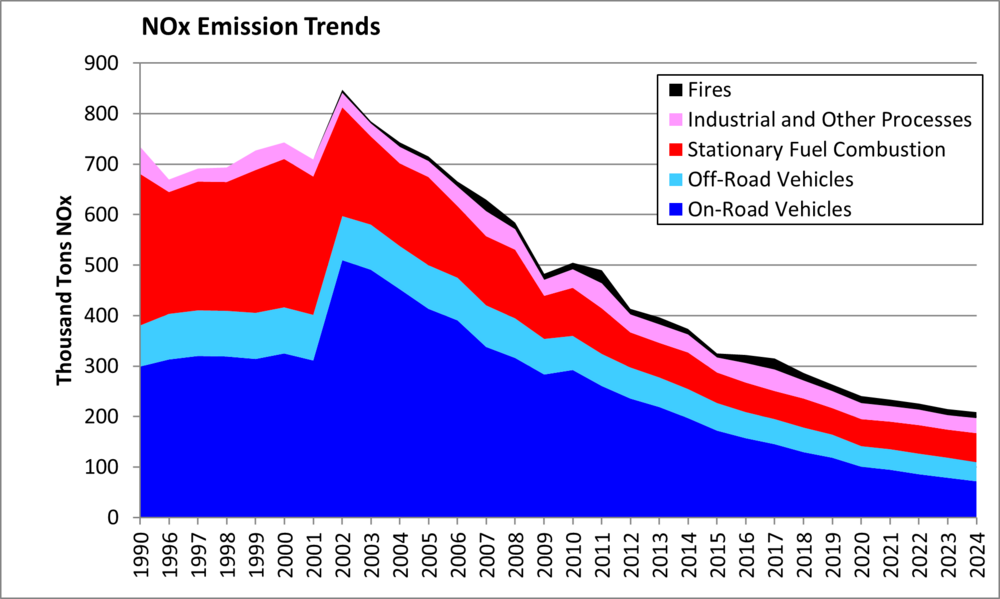
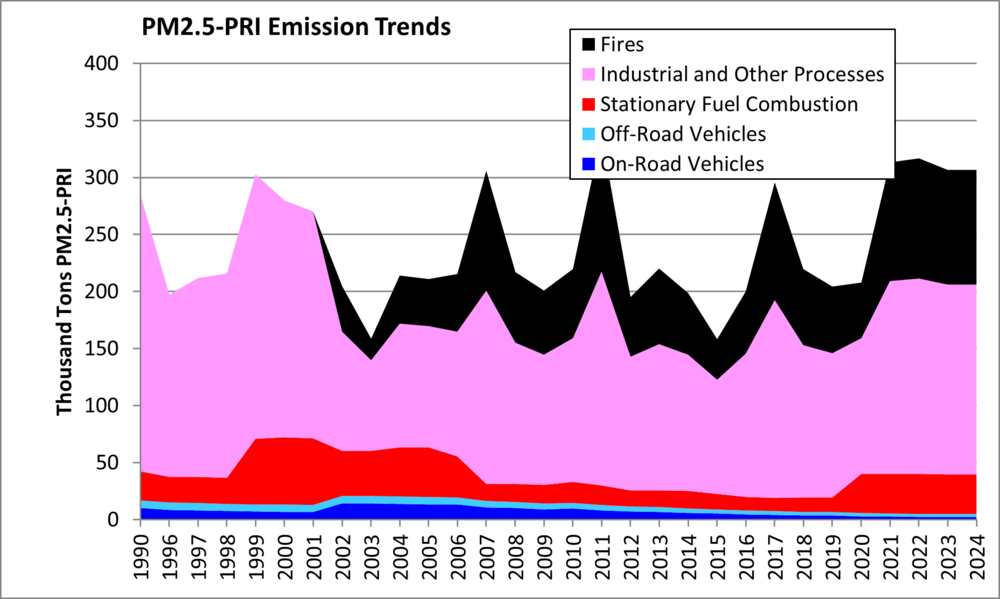
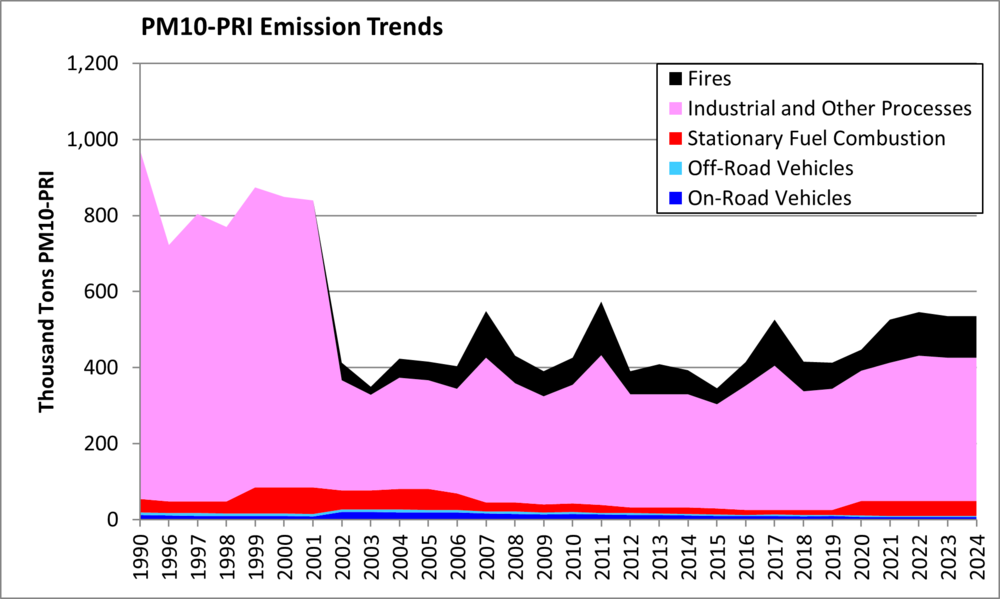
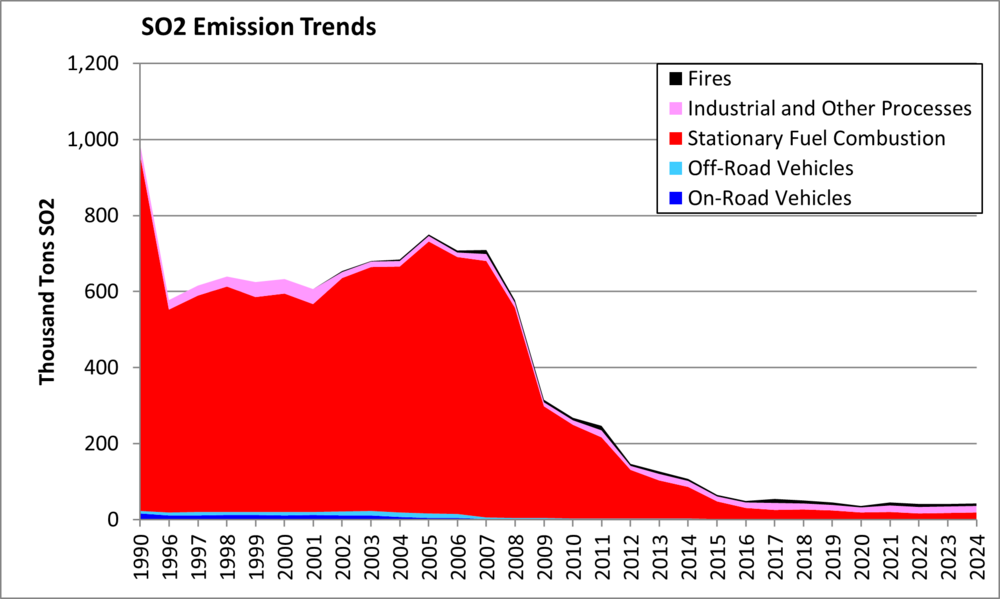
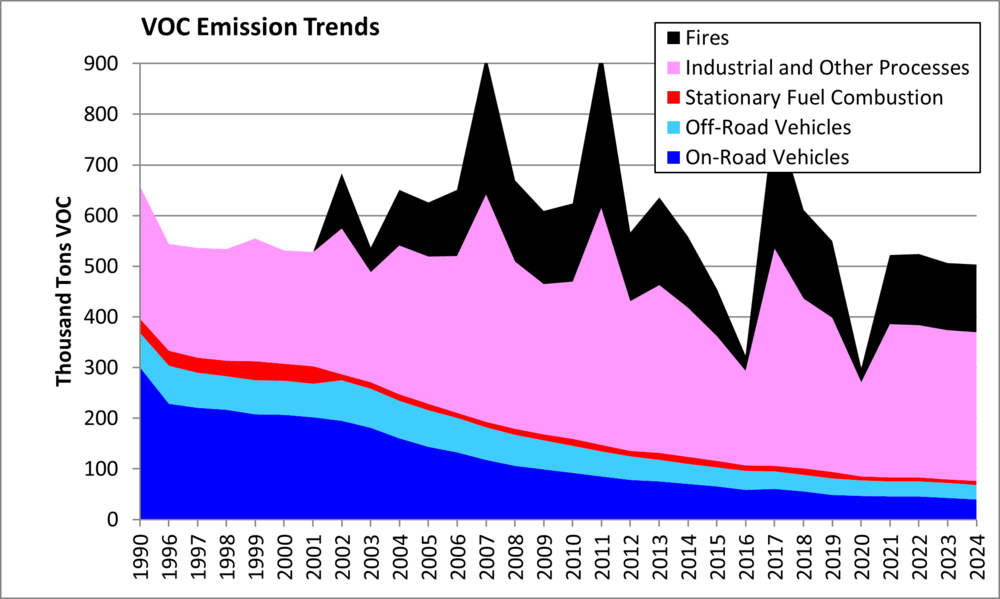
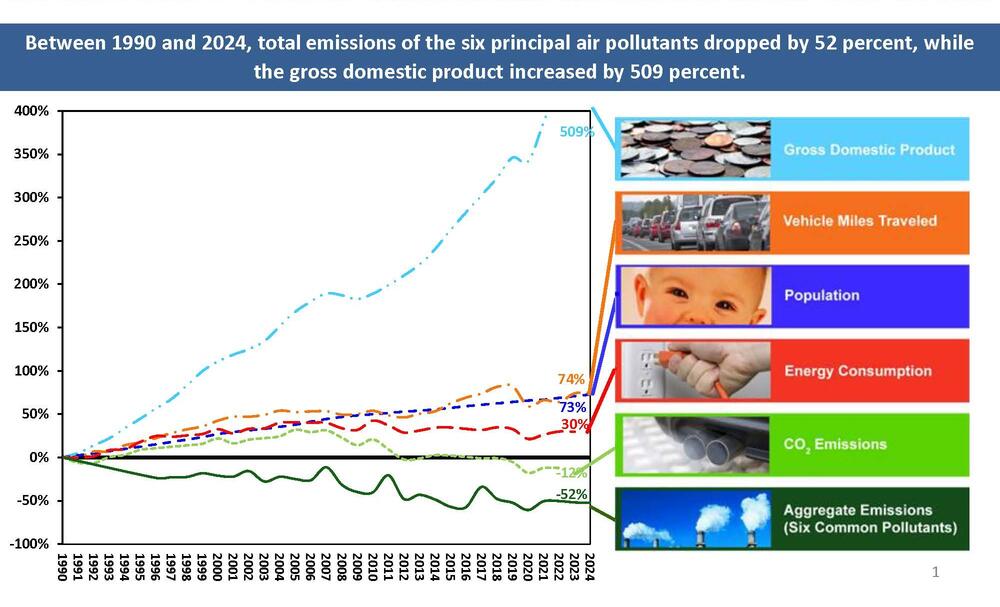
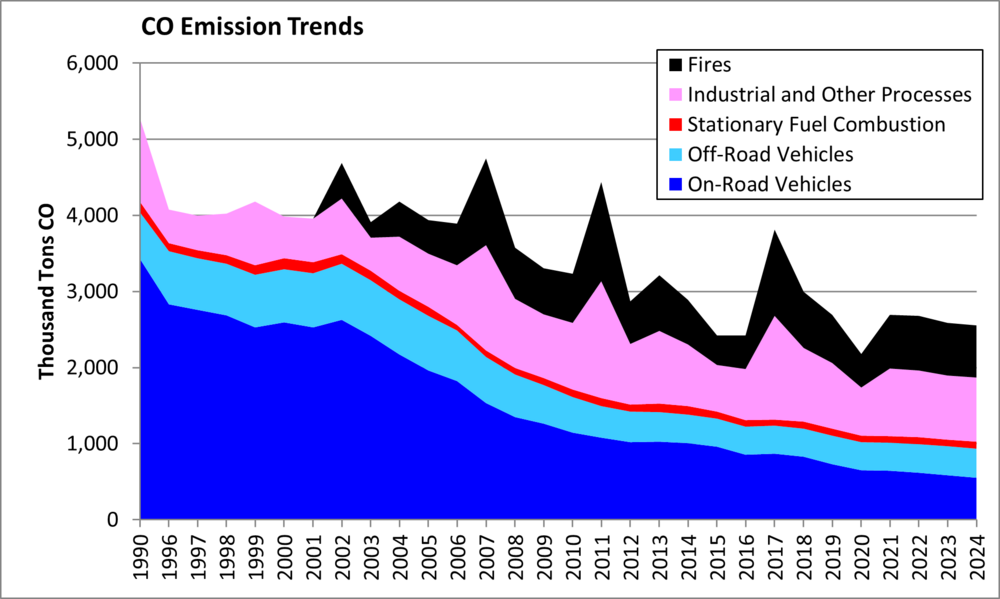
Overall, air quality is improving in Georgia because emissions of key air pollutants continue to decline from 1990 levels.